How To Use Performance Monitor On Windows 10 Detailed Guide
You can use Performance Monitor on Windows 10 to analyze data and keep a check on the performance of your system, but first, you must know how to open this tool. There are many ways to open the Windows Performance Monitor, let’s see a few of them:
How to open Performance Monitor How to Use Performance Monitor in Windows 10 How to add new counters under Performance Monitor How to Customize the Counter View in Performance Monitor Some Common Performance Counters How to Create a Data Collector Sets How to Use Reports to Analyse Collected Data
To open Performance Monitor using Run,
To open Performance Monitor using Control Panel,
How to Use Performance Monitor in Windows 10#
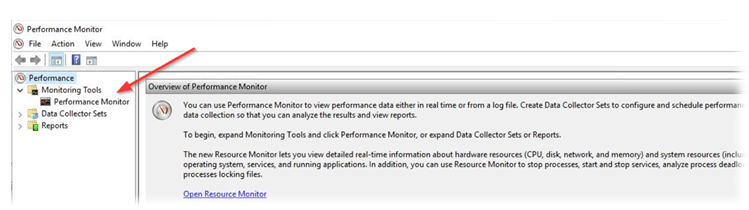
Make sure to create a restore point just in case something goes wrong. When you first open Performance Monitor, you will see the overview and system summary.
Now, from the left pane, select ‘Performance Monitor’ under ‘Monitoring Tools’. The graph you see here is the processor time over last 100 seconds. The horizontal axis displays time and the vertical axis displays the percentage of time your processor consumes working on the active programs.
Apart from the ‘Processor Time’ counter, you can also analyze many other counters.
How to add new counters under Performance Monitor#
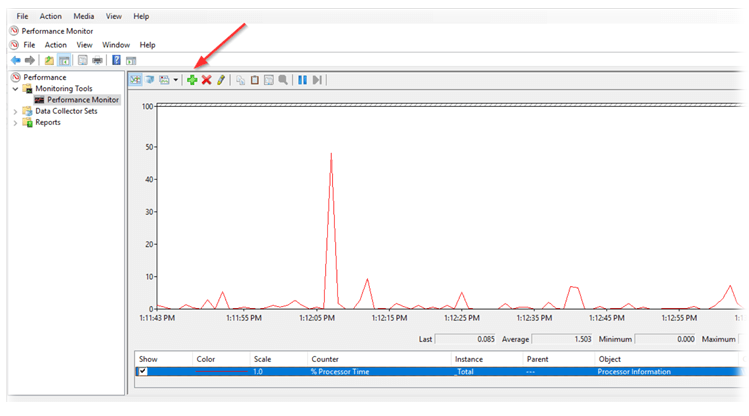
1.Click on the green plus shaped icon on top of the graph. 2.The Add Counters window will open. 3.Now, select the name of your computer (usually it is a local computer) in the ‘Select counters from computer’ drop-down menu.
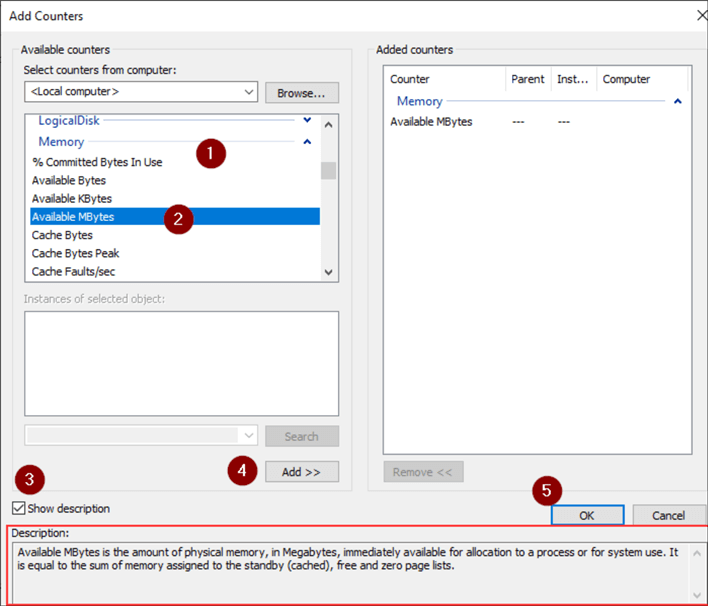
4.Now, expand the category of counters you want, say Processor. 5.Select one or more counters from the list. To add more than one counters, select the first counter, then press down the Ctrl key while selecting the counters.
6.Select the instances of the selected object(s) if possible. 7.Click on Add button to add the counters. The added counters will be shown on the right side.
8.Click on OK to confirm. 9.You will see that the new counters start to appear in the graph with different colors.
10.The details of each counter will be shown at the bottom, like which colors correspond to it, its scale, instance, object, etc. 11.Use the checkbox against each to counter to show or hide it from the graph. 12.You can add more counters by following the same steps as given above. Once you have added all the desired counters, it is time to customize them.
How to Customize the Counter View in Performance Monitor#
1.Double-click on any counter below the graph. 2.To select more than one counters, press down Ctrl key while selecting the counters. Then right-click and select Properties from the list. 3.Performance Monitor Properties window will open, from there switch to the ‘Data’ tab.
4.Here you can select the color, scale, width, and style of the counter. 5.Click on Apply followed by OK. An important thing to note here is that when you restart performance monitor, all these set counters and configurations will be lost by default. To save these configurations, right-click on the graph and select ‘Save settings as’ from the menu.
Type the desired file name and click on Save. The file will be saved as a .htm file. Once saved, there are two ways of loading the saved file for later use,
Another way to load it is by pasting counter list. However, this method may not work for some of the users. The third icon above the graph is for changing graph type. Click on the downward arrow beside it to select the type of graph. You can choose from line, histogram bar or report. You can also press Ctrl + G to switch between the graph types. The screenshots shown above correspond to the line graph. The histogram bar looks like this:
The report will look like this:
The pause button on the toolbar will allow you to freeze the constantly changing graph at any instance, if you want to analyze it. You can resume by clicking on the play button.
Some Common Performance Counters#
% Processor Time: This is the percentage of time spent by the processor in executing a non-idle thread. If this percentage stays over 80% constantly, it means it is difficult for your processor to handle all the processes. % Interrupt Time: This is the time required by your processor to receive and service hardware requests or interrupts. If this time exceeds 30%, there might be some hardware related risk.
% Committed Bytes In Use: This counter shows what percentage of your RAM is currently in use or is committed. This counter should fluctuate values as different programs are opened and closed. But if it keeps on increasing, there might be a memory leak. Available Bytes: This counter depicts the amount of physical memory (in Bytes) that are available for immediately allocating it to a process or system. A less than 5% of available bytes means you have very less memory free and may need to add more memory. Cache Bytes: This counter tracks the part of system cache which is currently active in physical memory.
% Usage: This counter tells the percentage of current pagefile in use. It should not be higher than 10%.
% Disk Time: This counter monitors the time taken by a drive to process read and write requests. This should not be too high. Disk Read Bytes/sec: This counter maps the rate at which bytes are transferred from the disk during the read operations. Disk Write Bytes/sec: This counter maps the rate at which bytes are transferred to the disk during write operations.
Bytes Received/sec: It represents the rate of bytes being received over each network adapter. Bytes Sent/sec: It represents the rate of bytes being sent over each network adapter. Bytes Total/sec: It includes both Bytes Received and Bytes Sent. If this percentage lies between 40%-65%, you should be cautious. For over 65%, the performance will be adversely affected.
% Processor Time: It tracks the amount of processor’s effort which is used by an individual thread.
For more information, you can go to the Microsoft website.
How to Create a Data Collector Sets#
A data collector set is a combination of one or more performance counters which can be saved to collect data over a period of time or on demand. These are especially useful when you want to monitor a component of your system over a specified time period, for instance, every month. There are two predefined sets available, System Diagnostics: This data collector set can be used troubleshooting issues related to driver failures, faulty hardware, etc. It includes data collected from System Performance along with other detailed system information. System Performance: This data collector set can be used to handle performance related issues like a slow computer. It collects data related to memory, processor, disk, network performance, etc. To access these, expand ‘Data Collector Sets’ in the left pane on Performance Monitor window and click on System.
To Create a Custom Data Collector Set in Performance Monitor, 1.Expand ‘Data Collector Sets’ in the left pane on Performance Monitor window. 2.Right-click on ‘User Defined’ then select New and click on ‘Data Collector Set’.
3.Type a name for the set and select ‘Create manually (Advanced)’ and click on Next.
4.Select ‘Create data logs’ option and check the ‘Performance counter’ checkbox.
5.Click Next then click on Add.
6.Select one or more counters you want then click on Add and then click OK. 7.Set the sample interval, to decide when the Performance Monitor takes samples or collects data and click on Next.
8.Set the location where you want it to be saved and click on Next.
9.Select a specific user you want or keep it default. 10.Select ‘Save and Close’ option and click on Finish.
This set will available in the User Defined section of the Data Collector Sets.
Right-click on the set and select Start to start it.
To customize the run duration for your data collector set, 1.Right-click on your data collector set and select Properties. 2.Switch to ‘Stop condition’ tab and check the ‘Overall duration’ checkbox. 3.Type the time duration for which you want Performance Monitor to run.
4.Set other configurations then click on Apply followed by OK. To schedule the set to run automatically, 1.Right-click on your data collector set and select Properties. 2.Switch to ‘Schedule’ tab then click on Add. 3.Set the schedule you want then click on OK.
4.Click on Apply and then click on OK.
How to Use Reports to Analyse Collected Data#
You can use reports to analyze the data collected. You can open reports for both predefined data collector sets and your custom sets. To open system reports,
To open a custom report,
Using Performance Monitor, you can carry out the analysis for almost every part of your system easily. Recommended:
Fix USB Composite Device can’t work properly with USB 3.0 Why is Windows 10 Updates Extremely Slow? Print Screen Not Working? 7 Ways to Fix it! Disable OneDrive on Windows 10 PC
I hope this article was helpful and you can now easily Use Performance Monitor on Windows 10, but if you still have any questions regarding this tutorial then feel free to ask them in the comment’s section.
Performance Monitor
You may often like to know at what level your system is performing its various tasks, and to see if it is effectively handling all of your applications and file transfers. This tool can help you find out.
Performance Monitor is a free application for Windows that allows you to view the status of your system’s most important aspects whenever you want, as well as its general performance, all in real time.
The first thing you’ll notice about the program is its look. The program launches four small, customizable squares in different colors (representing the different devices they analyze): blue (processor), green (memory), red (disc drive), and yellow (network).
It also includes a large number of options related to both the interface as well as the actual system monitoring, all of which combines to make Performance Monitor a truly interesting tool.
Reviewed by Álvaro Toledo Translated by Uptodown Localization Team
Advertisement
More information
| License | Free |
| Op. System | Windows |
| Category | Performance |
| Language | English |
Введение в Windows Performance Monitor (Perfmon) для диагностики SQL Server
Данный материал является переводом оригинальной статьи «MSSQLTips : Joe Gavin : Introduction to Windows Performance Monitor for SQL Server».
В данной вводной статье, мы узнаем о том, как можно использовать Windows Performance Monitor для изучения проблем с производительностью Microsoft SQL Server. Узнаем, что такое Performance Monitor и рассмотрим несколько примеров добавления счетчиков, сохранения повторно используемых шаблонов и составления отчетов по данным о производительности.
Что такое Windows Performance Monitor?
Windows Performance Monitor (далее «монитор производительности»), обычно называемый просто Perfmon, представляет собой программу Windows, используемую системными администраторами для мониторинга ряда системных областей, а также очень полезный инструмент для администраторов баз данных. Он существует со времен Microsoft Windows 3.51. Perfmon может отображать информацию в режиме реального времени или из файлов журнала для последующего просмотра.
Как монитор производительности может мне помочь?
Perfmon может отслеживать стандартные счетчики производительности (ЦП, процессорное время, память, сеть, физический диск, чтение с диска и т.д.), которые устанавливаются вместе с операционной системой Windows, а также специальные счетчики, устанавливаемые с SQL Server.
Запуск монитора производительности
Примечание. Все ниже описанные примеры выполнялись на Windows Server 2019 Standard с SQL Server 2019 Standard.
Существует несколько способов запуска монитора производительности, в том числе:
- Start > Введите «Performance Monitor» в строке поиска
- Start > «Windows Administrative Tools» > «Performance Monitor«
- Щелкните ПКМ Start > «Run» > наберите «perfmon» в строке запуска
- Клавиша «Windows» + «R» > наберите «perfmon«в строке запуска
Какой бы способ вы ни выбрали, вам будет представлен монитор производительности. Щелкните «Performance Monitor» в дереве навигации слева.
Добавление счетчиков Perfmon
Счетчик «% Processor Time» запущен по умолчанию. Нажмите на зеленый плюс на верхней панели кнопок, чтобы начать добавлять счетчики.
В списке вы увидите большое количество объектов или категорий Perfmon. И под каждым Объектом находится почти невероятное количество Счетчиков. Ничего страшного, мы просто сосредоточимся на некоторых из них.

- Прокрутите вверх, чтобы щелкнуть раскрывающийся список объекта, который вас интересует;
- Выберите Счетчик;
- При необходимости установите флажок «Show description«, чтобы получить описание Счетчика;
- Нажмите «Add«;
- Нажмите «OK«
Нажав на Счетчик, мы увидим график добавленного Счетчика и его показателей.
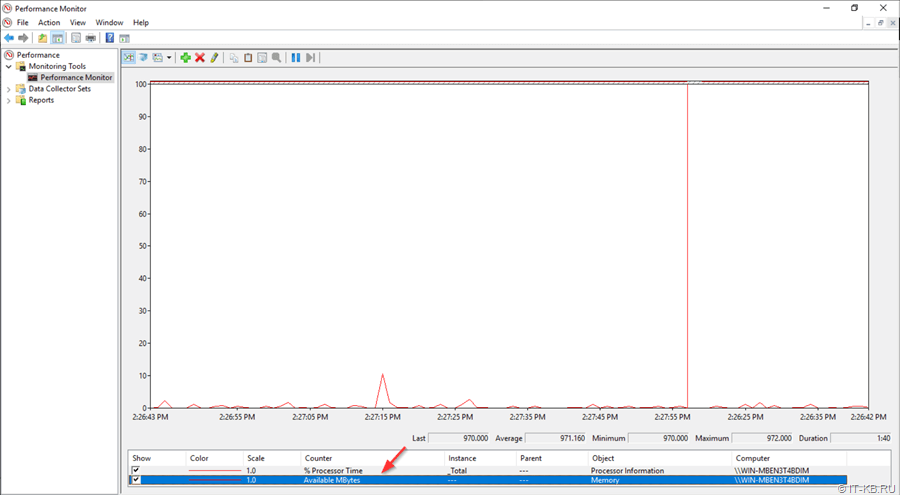
Мы вернулись и добавили некоторые стандартные счетчики мониторинга SQL Server таким же образом, как мы добавили Memory \ Available MBytes, и теперь у нас есть следующие запущенные объекты \ счетчики:
Perfmon Объект
Perfmon Счетчик
При подготовке материала использовались источники:
https://ditechcult.pages.dev/posts/how-to-use-performance-monitor-on-windows-10-detailed-guide-/
https://performance-monitor.en.uptodown.com/
Введение в Windows Performance Monitor (Perfmon) для диагностики SQL Server